Sustainability
At Ford, our purpose has always been bigger than building vehicles. We are driven by a desire to build a better world. The Road to Better is Ford’s commitment to building a more sustainable, inclusive and equitable transportation future where every person is free to move and pursue their dreams.
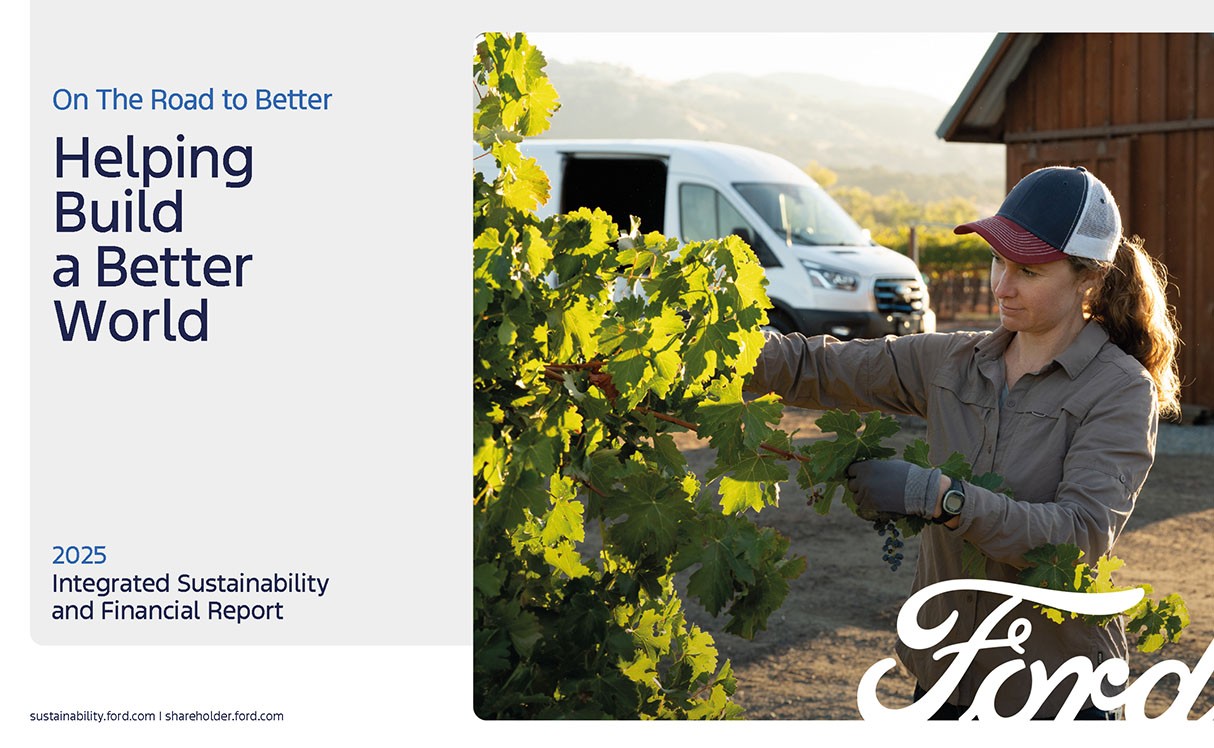
2025 INTEGRATED SUSTAINABILITY AND FINANCIAL REPORT
This marks Ford’s 26th year of sustainability reporting. We’re proud of our long track record of aligning our business practices with human and environmental concerns, measuring success not only on the strength of our balance sheet, but also on how we impact our planet, our employees, and the communities we call home. We invite you to learn more about our progress in our fifth annual Integrated Report.
ADDITIONAL DOWNLOADS
ACCELERATING OUR PROGRESS
We believe that everyone should experience the benefits of clean air, clean water, and carbon neutral transportation, which is why we are taking action to achieve carbon neutrality no later than 2050. We build vehicles that move people, both physically and emotionally. But that’s not all we’re here to do. We’re also here to move the needle.
BETTER PRODUCTS
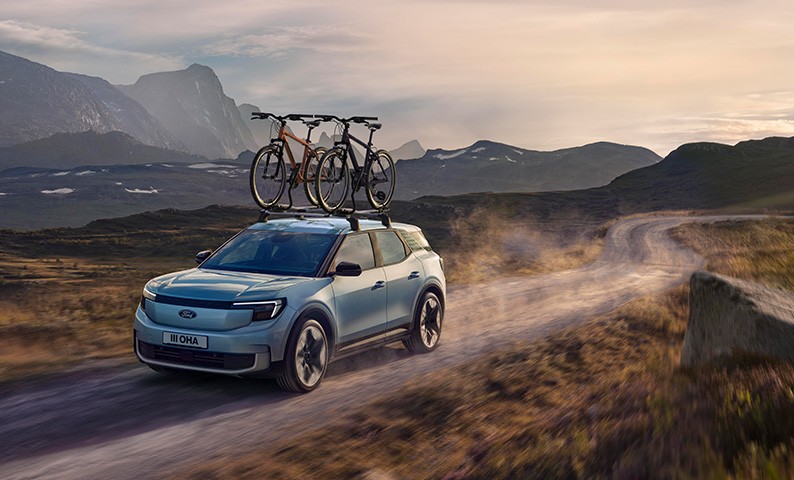
Ford is a leader in offering a range of gas, hybrid, and electric vehicles to suit almost any need, providing our customers with more options on the path to carbon neutral transportation.
BETTER BUSINESS
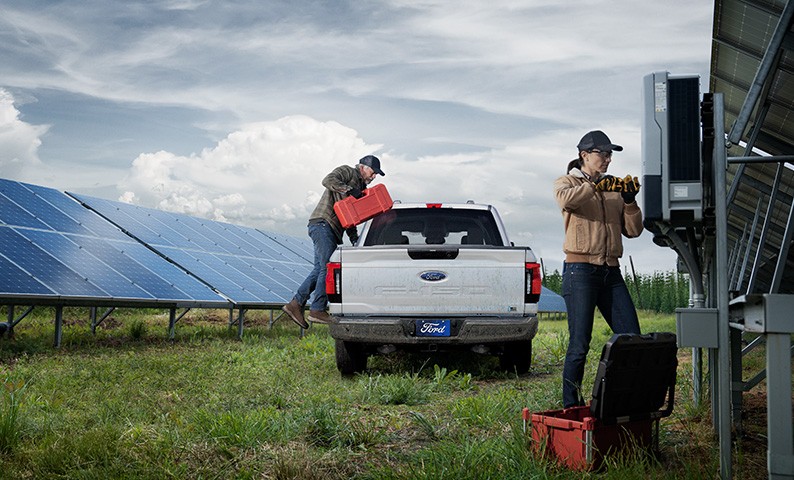
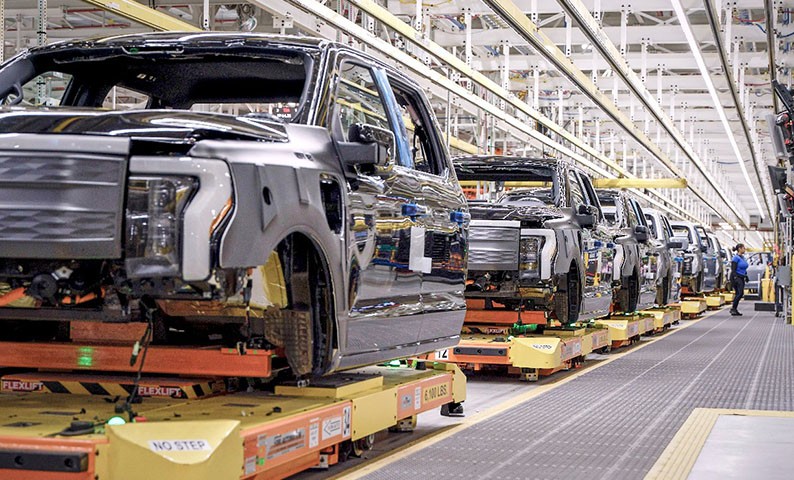
The commitment to reducing our environmental impact runs through our entire business. We are improving energy efficiency in our global manufacturing, moving toward 100% carbon-free electricity.
BETTER TOGETHER
We believe lasting change requires working together. We work with our supply chain through Transform: Auto and Manufacture 2030, to increase renewable energy and help our suppliers meet their carbon reduction targets.
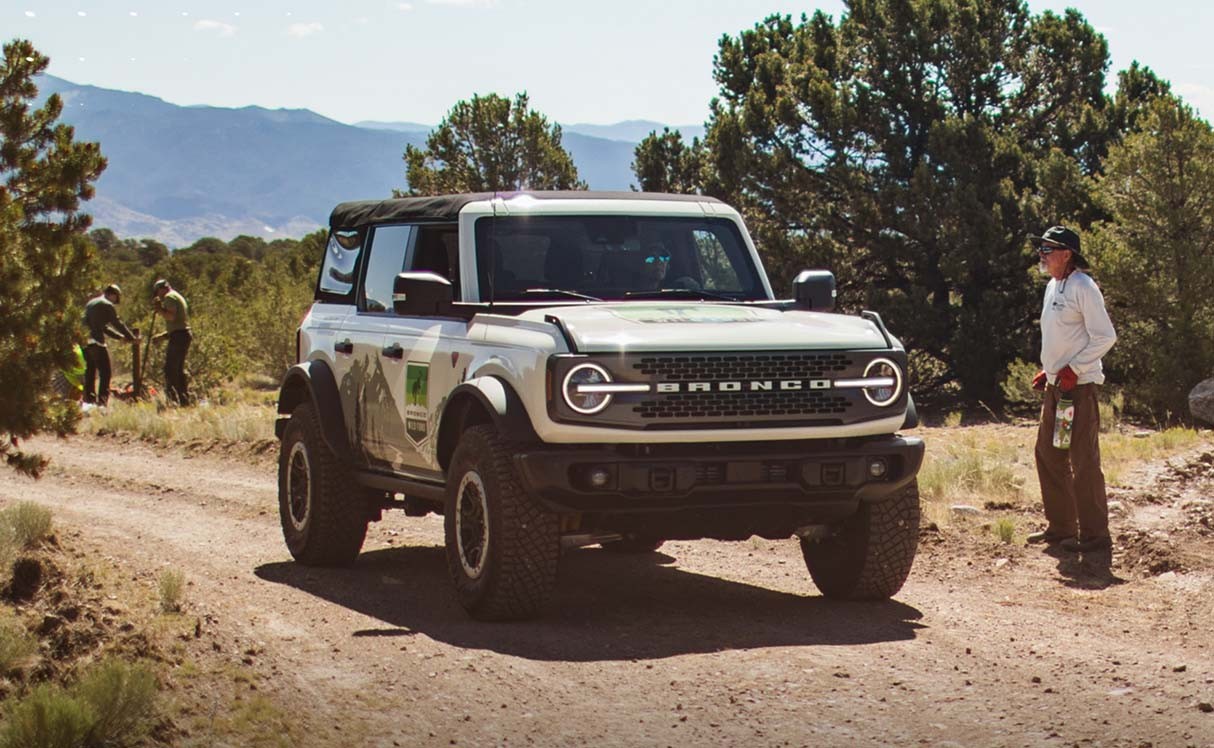
2023 BRONCO WILD FUND IMPACT REPORT
In 2023 Bronco Wild Fund provided more than $2.3M in support of access, preservation, and stewardship projects impacting over 44 states, a 46% increase over prior year. These initiatives impacted over 108,000 people, improved 11,648+ miles of trail, preserved 3,103 acres of land, and helped collect 1,283,711 pounds of trash. Learn more about the efforts in the 2023 Impact Report.
EXTERNAL GRIEVANCES
You have identified a violation of human rights or the environment? Do not hesitate and inform us. Click below for next steps.